NASA space laser missions map 16 years of ice sheet loss
Mines Geophysics' Matthew Siegfried was part of the research team that published its results today in Science
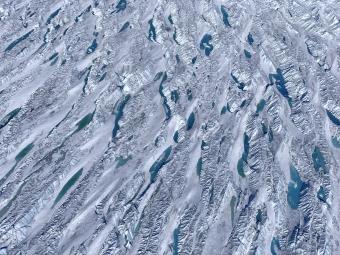
An ice sheet in Greenland, seen from the air in May 2019. (Photo courtesy of Matthew Siegfried)
A Colorado School of Mines glaciologist was part of a team of scientists that used the most advanced Earth-observing laser instrument NASA has ever flown in space to make precise, detailed measurements of how the elevation of the Greenland and Antarctic ice sheets have changed over 16 years.
The results, published online in Science on April 30, provide insights into how the polar ice sheets are changing, demonstrating definitively that small gains of ice in East Antarctica are dwarfed by massive losses in West Antarctica. The scientists found the net loss of ice from Antarctica, along with Greenland’s shrinking ice sheet, has been responsible for 0.55 inches (14 millimeters) of sea level rise between 2003 and 2019 – slightly less than a third of the total amount of sea level rise observed in the world’s oceans.
The findings come from NASA’s Ice, Cloud and land Elevation Satellite 2 (ICESat-2), which launched in 2018 to make detailed global elevation measurements, including over Earth’s frozen regions. By comparing the recent data with measurements taken by the original ICESat mission from 2003 to 2009, researchers have generated a comprehensive portrait of the complexities of ice sheet change and insights about the future of Greenland and Antarctica.
"ICESat-2 is really an incredible feat of engineering. It's hurtling through space at over 15,000 miles per hour, with its instrument firing a laser 10,000 times per second. Each of these laser pulses sends out 300 trillion photons, with only 10-12 photons reflecting off the Earth's surface and returning to the satellite for us to use to do our science. And from this instrument, we are able to see the Earth's ice sheets in finer detail and higher accuracy than ever before,” said Matthew Siegfried, assistant professor of geophysics at Mines and a co-author on the new paper. “We are only starting the scratch the surface of what ICESat-2 can tell us about changes occurring at the Earth's poles."
The study published in Science found that Greenland’s ice sheet lost an average of 200 gigatons of ice per year, and Antarctica’s ice sheet lost an average of 118 gigatons of ice per year.
One gigaton of ice is enough to fill 400,000 Olympic-sized swimming pools or cover New York’s Central Park in ice more than 1,000 feet (300 meters) thick, reaching higher than the Chrysler Building.
“If you watch a glacier or ice sheet for a month, or a year, you’re not going to learn much about what the climate is doing to it,” said Ben Smith, a glaciologist at the University of Washington and lead author of the new paper. “We now have a 16-year span between ICESat and ICESat-2 and can be much more confident that the changes we’re seeing in the ice have to do with the long-term changes in the climate.”
ICESat-2’s laser altimeter instrument sends out pulses of light to Earth’s surface and times how long it takes to return to the satellite – to within a billionth of a second. The instrument’s pulse rate allows for a dense map of measurement over the ice sheet; its high precision allows scientists to determine the how much an ice sheet changes over a year to within an inch.
The researchers took tracks of earlier ICESat measurements and overlaid the tracks of ICESat-2 measurements from 2019, then extracted data from the tens of millions of sites where the two data sets intersected. That allowed the team to estimate the elevation change, but turning that observation into how much ice has been lost is complicated: the researchers needed to develop a new model to convert volume change to mass change. This model calculated ice densities across the ice sheets to allow the total mass loss to be calculated.
“These first results looking at land ice confirm the consensus from other research groups, but they also let us look at the details of change in individual glaciers and ice shelves at the same time,” said Tom Neumann, ICESat-2 project scientist of NASA Goddard Space Flight Center.
In Antarctica, for example, the detailed measurements showed that the ice sheet is thickening in parts of the continent’s interior as a result of increased snowfall, according to the study. But the loss of ice from the continent’s margins, especially in West Antarctica and the Antarctic Peninsula, far outweighs any gains in the interior. In those places, the loss is due to warming from the ocean.
In Greenland, there was a significant amount of thinning of coastal glaciers, Smith said. The Kangerdulgssuaq and Jakobshavn glaciers, for example, have lost 14 to 20 feet (4 to 6 meters) of elevation per year – the glacial basins have lost 16 gigatons per year and 22 gigatons per year, respectively. Warmer summer temperatures have melted ice from the surface of the glaciers and ice sheets, and in some basins the warmer ocean water erodes away the ice at their fronts.
“The new analysis reveals the ice sheets’ response to changes in climate with unprecedented detail, revealing clues as to why and how the ice sheets are reacting the way they are”, said Alex Gardner, a glaciologist at NASA’s Jet Propulsion Laboratory in Pasadena, California, and co-author on the Science paper.
The study also examined ice shelves – the floating masses of ice at the downstream end of glaciers. These ice shelves, which rise and fall with the tides, can be difficult to measure, said Helen Amanda Fricker, a glaciologist at Scripps Institution of Oceanography at the University of California San Diego, and co-author on the Science paper. Some of them have rough surfaces, with crevasses and ridges, but the precision and high resolution of ICESat-2 allows researchers to measure overall changes.
This is one of the first times that researchers have used laser altimetry to measure loss of the floating ice shelves around Antarctica simultaneously with loss of the continent’s ice sheet.
The researchers found ice shelves are losing mass in West Antarctica, where many of the continent’s fastest-moving glaciers are located as well. Patterns of thinning over the ice shelves in West Antarctica show that Thwaites and Crosson ice shelves have thinned the most, an average of about 16 feet (5 meters) and 10 feet (3 meters) of ice per year, respectively.
Ice that melts from ice shelves doesn’t raise sea levels, since it is already floating – just like an ice cube in a full cup of water doesn’t overflow the glass. But the ice shelves do provide stability for the glaciers and ice sheets behind them.
“It’s like an architectural buttress that holds up a cathedral,” Fricker said. “The ice shelves hold the ice sheet up. If you take away the ice shelves, or even if you thin them, you’re reducing that buttressing force, so the grounded ice can flow faster.”
Mines’ Siegfried has been involved with ICESat-2 since the beginning of his PhD work a decade ago at Scripps Institution of Oceanography. There, he helped develop ground-finding algorithms, validation plans, and processing schemes to generate the data products that are now served by NASA.
“As a postdoctoral scholar, I had the opportunity to watch ICESat-2 launch from Vandenberg Air Force Base – where tears were shed by many – and then assess the first data returns during the satellite's commissioning phase,” Siegfried said. “Now as a professor at Mines, I have the opportunity to finally do science with the data streaming from the satellite! It's really been a wild, fun ride with this mission.”
For more information on ICESat-2, visit https://nasa.gov/icesat-2 or https://icesat-2.gsfc.nasa.gov.

About Mines
Colorado School of Mines is a public R1 research university focused on applied science and engineering, producing the talent, knowledge and innovations to serve industry and benefit society – all to create a more prosperous future.


